Excel Dashboard - Coffee Insights
Excel Dashboard - Coffee Insights
Excel Dashboard - Coffee Insights
A Comprehensive Sales Analytics Interface for Coffee Connoisseurs on Microsoft Excel || Advanced Excel, Power Query
A Comprehensive Sales Analytics Interface for Coffee Connoisseurs on Microsoft Excel || Advanced Excel, Power Query
A Comprehensive Sales Analytics Interface for Coffee Connoisseurs on Microsoft Excel || Advanced Excel, Power Query

Uncover the aroma of success through the Bean to Brew Insights Dashboard, a robust analytical tool crafted in Microsoft Excel to provide a rich blend of sales data.
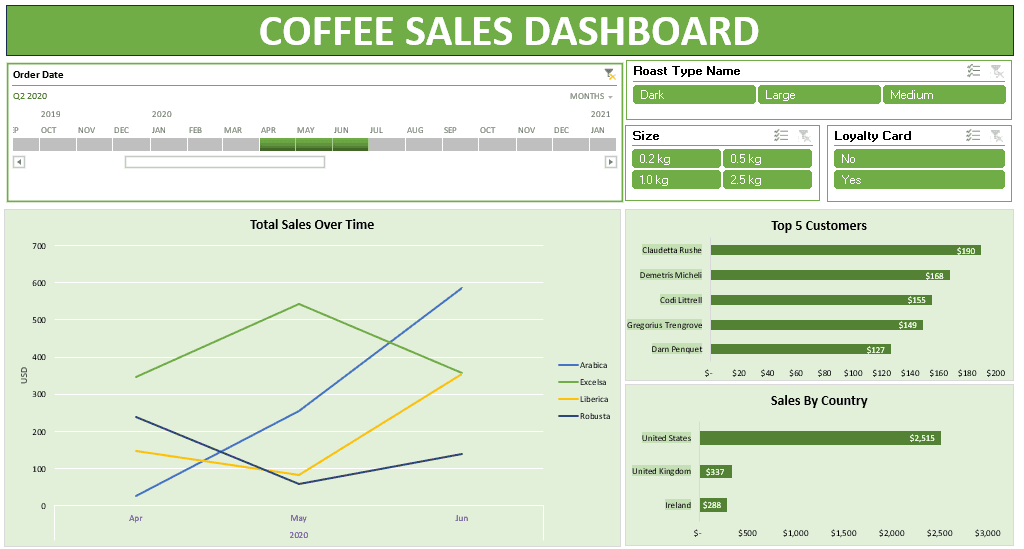
Discover your top 5 customers, track sales evolution, and delve into geographical sales distributions, all segmented by roast type, size, and loyalty card ownership.

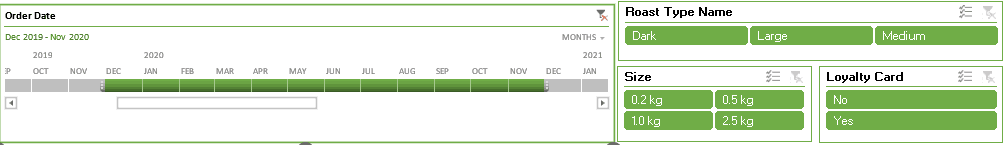
With functionalities like Pivot Tables, XLOOKUP, INDEX MATCH, Power Query, and intuitive filters and slicers, navigating through your coffee sales metrics is just as refreshing as a morning brew.
Uncover the aroma of success through the Bean to Brew Insights Dashboard, a robust analytical tool crafted in Microsoft Excel to provide a rich blend of sales data.
Discover your top 5 customers, track sales evolution, and delve into geographical sales distributions, all segmented by roast type, size, and loyalty card ownership.
With functionalities like Pivot Tables, XLOOKUP, INDEX MATCH, Power Query, and intuitive filters and slicers, navigating through your coffee sales metrics is just as refreshing as a morning brew.